I have posted previously about Section View creation, but here is a nice workflow from Jeremy Graham on Module 2 at the Learn Dynamo website, original post here. Great work and an excellent explanation too. Full credit to Jeremy Graham for this workflow.
Content:
The script was primarily built for model lines although it can be used for any line based family type such as walls …


Select Model Elements is used to select the model elements in the project file. From these curve elements, CurveElement.Curve allows us to extract the base curve of the element into a usable Dynamo format. This is where you would need to alter the script to suit selecting walls.

Once we have the curves we need, we can start extraction information from them for the script. StartPoint and CurveEndPoint both do just what they sound like ; get the endpoints of the curves. These points are then combined into a single list using List.Create and the result is transposed using List.Transpose. If you are not familiar with the concept or transpose, it is basically used to interchange the number of rows with the number of columns in a matrix or vice versa. In this case, the list of two sub lists has been transposed into a list of six sub lists based on the original number of items in the first list. This list of points has been transposed to match the number of planes coming out of Plane.XAxiz. This can be seen in the two watch nodes below where the left is before the transform and the right is after.
From the curve elements we also extract a coordinate system using Curve.CoordinateSystemAtParameter. This is set at parameter 0.5 which is the midpoint of the straight line. Using this new coordinate system, we create a plane with Plane.XAxis and convert the coordinate systems to points using Point.ByCartesianCoordinates.


The list of transposed points and planes extracted in part 2 can now be moved or translated using the Translate node. The new planes will be used for the elevation markers and the curve end points will set up the boundary of the crop views. The Number Slider allows us to adjust the location of these points in relation to the model line. Putting this number in the positive or negative spectrum will adjust the marker location to either side of the model line.
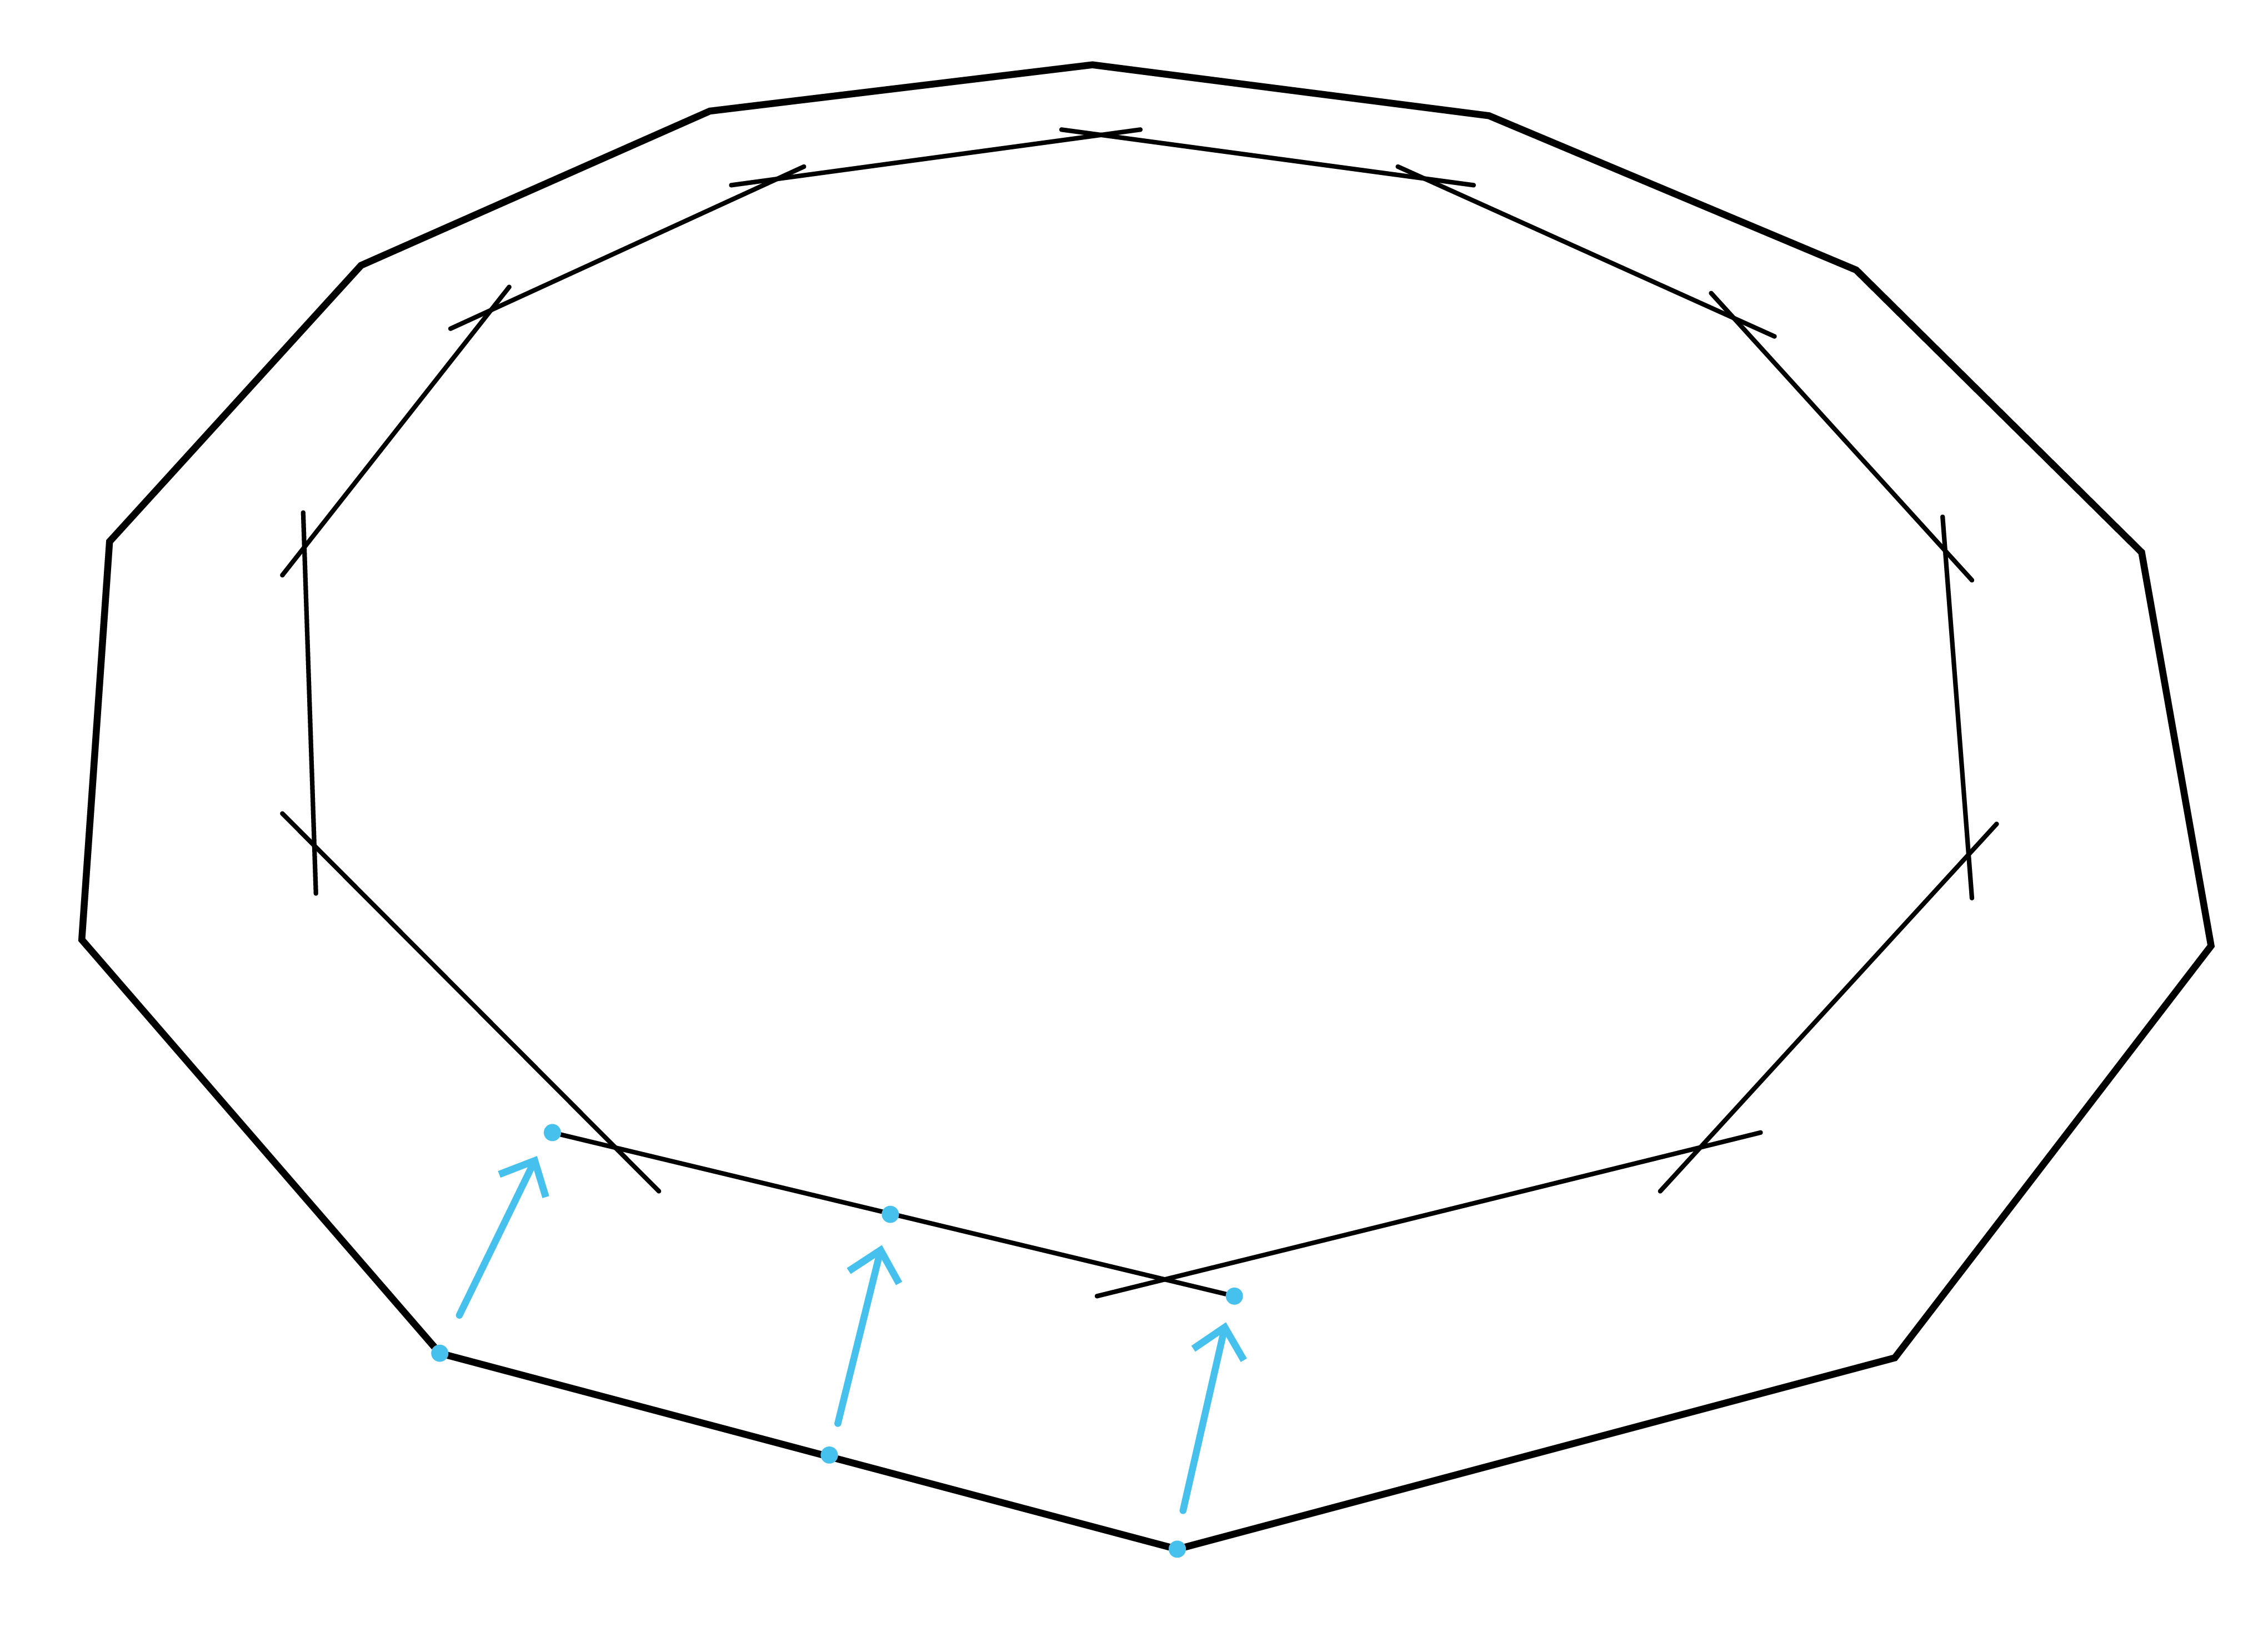
A diagram of what is occurring in this section is shown below. This is based on a dodecagon shape made up my model lines.


Using the translated points for the crop view boundary, we once again transpose the list so that we can swap the list back to its original form of 2 items. Once it is in this form List.FirstItem and List.LastItem are used to get all the items from each sub list.
The translated points for the elevation markers will be used later when the elevations are created.

Now that we have all the translated curve endpoints in two separate lists, we can use these to create new lines with the Line.ByStartPointEndPoint. These lines will make up the base of the crop views so Curve.ExtendEnd and Curve.ExtendStart nodes are added so that we can extend the crop view as needed by the value stated in the Code Block.

From the extended curves, we once again get the start and end points from Curve.StartPoint and Curve.EndPoint respectively. A list is then made from these and transposed to achieve the same result as shown in part 2 which is the end points of each crop view in their own sub list. This can be seen below in the sample diagram.


Similarly to part 3, the points obtained in part 6 are translated using Geomery.Translate but this time in the Z axis using Vector.ZAxis. This creates the upper corners of the crop views that will be created and are controlled using either Number Slider to move the points up or down.

Both lists from the Geometry.Translate nodes are transposed so that all end points are grouped together and in the same fashion of part 4, we gather up each of the end points using List.FirstItem and List.LastItem. All of these points now form the corners of each crop view that will be created. Therefore, they are grouped together in the List.Create node and in an anti-clockwise order.

List.Transpose makes a return to separate all these grouped lists into their corresponding crop views so we now have all the points of each crop view in their own sub list. From this, PolyCurve.ByPoints is used to make a loop from each sub list of points. Each curve of these loops are then extracted using PolyCurve.Curves so that they can be used in the following Python Script. The poly curves that have now been created are shown diagrammatically below.


Before we create the elevations, we need to select the ViewFamily Type to use. This Python Script does just that. The details of this are shown below starting at part 10.1 onwards. The output of this script is a list with two sublists, one that contains the ViewFamily Types and the other with their names. With this information, we can use the Code Block node to first select the list of elements using the [0] code and then the number of which element we want to use, in this case the first so another [0] is added.

The final part of this module is completed using a Python Script. I originally thought this would be a simple script but it turned out to be quite large. It’s relatively simple to understand though so please read through to get an understanding of how it works in part 11.1 onwards.


With these Python Scripts I am not going to explain the importing parts as the reason for these are explained in module 1.
To start, 3 empty lists are created under the variables elements, names and lst. These will be the outputs of the script.

A FilteredElementCollector is then used to filter the document (doc) of class ViewFamilyType and the result is set to the variable collector as elements.

With all these elements collected, we loop through them with a for loop. In the first loop, we find View Families of the type Elevation and append it to the elements list. Then another loop is set up to loop through the parameters of this element. Once the loop finds the elements Type Name it appends this to the names list. Finally, both the elements list and names list are appended to the output list; lst.


The incoming data is stored under the corresponding variables. This includes the points where the elevation markers will be created (points), the midpoint of the original model lines (modelPoints), the curves that make up the crop views (cropCurves) and the ViewFamily type chosen in part 10 (viewType).

As shown in module 1, the toggle is set to True to make the script activate. This is so we can refresh the script if needed. We then start a transaction which is needed to create elements within Revit, more information about this can be found here.
We then start a for loop through the points list. The enumerate function is used to get the index of each item in the list. So , we can then get the model line mid-point (modelMP) from the modelPoints list at the same index as the current point in the points list.
ToXyz converts the Dynamo point to Revit type as explained in this link and from this the X and Y values are taken from modelMP.

Each individual curve line is taken from the cropCurves list at the same index as the current point in the points list. Each one of these curves are set to l1, l2, l3 and l4.

The current elevation marker point is set to elevationPT. This is used to make another point (elptRotate) which is located 100 units above elevationPT in the Z axis and both points are used to make a line set to ln. This line will be used as the axis for elevation marker rotation.

In this part, the X and Y values are taken from the elevationPT point and with these values, we subtract the modelMP X and Y values that we extracted earlier. These new values are then used to perform an atan2 function which gets us the angle between both points. This angle will be used to rotate the elevation marker towards the model line.

With all the information gathered, we can now create an elevation marker using the document (doc), view type (viewType.Id), location point (elevationPT) and scale of view (100). An elevation is then created at that marker and set to variable ele.
The elevation marker is then rotated to be pointing at the wall using ElementTransformUtils.RotateElement(Document, element ID, rotation axis, angle).

The crop region manager is set to crManager and then we gather the curves brought in earlier to form a new curve loop which is then set to cLoop.

Finally, we try to set the crop region of the elevation to the new curve loop using SetCropRegionShape and hopefully it is successful!
If the python script is successful then we should have a group of newly formed elevations show up in revit, all pointing towards the model line at the side set. The crop region should also be set as per the parameters in parts 3 and 7 for length and height respectively.
An example of how this should appear can be seen below. If you come across any problems, please let me know but hopefully that isn’t the case. Also, if there is anything I haven’t fully explained or you do not fully understand please give me a shout via email or in the comments below. In addition to these, if you liked the script and want more, please follow me on twitter @LearnDynamo and subscribe to the emailing list below for the next module release.